

Electric Transaxle Efficiency Testing and Range Impact: A B2B Engineering Guide for EV and Equipment OEMs
For EV and equipment OEMs, an electric transaxle is rarely bought for its peak number on a datasheet. It is bought for what reaches the wheel after heat, friction, and control losses take their cut. A half-point swing in system efficiency changes how far a truck travels per charge, how long a scrubber runs per shift, and how big a battery the vehicle needs to begin with. Yet efficiency is the most abused figure in the category: suppliers quote a single best point measured under friendly conditions and call it the product. This guide walks engineering and procurement teams through where the losses actually come from, how a credible efficiency map is built and read, why rated, peak, and weighted efficiency are three different numbers, and how to turn all of that into a contract clause you can enforce. The audience is the buyer who specs the drivetrain, runs the bench, or signs the purchase order, not the end consumer.
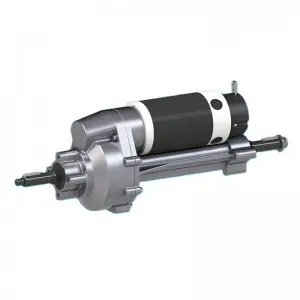
Anatomy of Efficiency Loss in an Electric Transaxle
An electric transaxle is an integrated assembly: a motor, a reduction gear set, a differential, and often an electromagnetic brake, all sharing one housing and one lubrication bath. Every watt that enters the input terminals does not reach the wheel. The losses split into mechanical and electrical buckets, and knowing the size of each bucket tells you where to push for improvement.
On the mechanical side, each gear mesh typically consumes 1.0 to 2.0 percent of transmitted power as tooth friction. A two-stage reduction with four active tooth meshes can therefore lose 4 to 6 percent before any bearing or seal loss is counted. Tapered or deep-groove ball bearings add 0.3 to 0.8 percent depending on preload and grease viscosity. A worn or over-compressed oil seal lip can add another 0.2 to 0.5 percent as steady drag that never goes away, even when the vehicle is coasting. The differential itself, with its side and pinion gears, contributes a further 0.3 to 0.6 percent under cornering and a smaller amount in straight running.
On the electrical side, the motor dominates. Copper loss scales with the square of phase current: at 48 V and 120 A the I²R loss in a 0.05 ohm winding reaches roughly 720 W. Iron loss from hysteresis and eddy currents grows with magnetic frequency and stays present even at light load, which is why small-input conditions are never free. A typical 3 kW transaxle at its best operating point reaches 88 to 91 percent system efficiency; a poorly tuned unit with high seal drag, loose-bearing preload, and a mismatched controller can sit at 80 to 83 percent. That gap, applied across thousands of operating hours, is the difference between a viable product and a returns nightmare.
Building and Reading an Efficiency Map
An efficiency map plots system efficiency as a function of speed and torque, usually on a grid of 8 to 12 speed lines from 200 rpm to 3000 rpm and 6 to 10 torque columns from 5 Nm up to the rated 80 to 200 Nm. To generate it you need a back-to-back dynamometer rig where one unit is driven as a motor and a second as a generator, or a single unit coupled to a load absorption dynamometer. The back-to-back arrangement recirculates most of the energy and only the losses are drawn from the grid, which keeps power bills and cooling loads manageable during a 400 to 600 point sweep.
Each point is held for 30 to 60 seconds to let temperatures stabilize, and torque is measured with a calibrated shaft transducer with 0.2 percent full-scale accuracy. Speed is set by the drive inverter, input power comes from a precision power analyzer, and output power is the product of measured torque and measured speed. The resulting contour plot shows a ridge of high efficiency around 60 to 80 percent of rated torque and 40 to 70 percent of rated speed; efficiency falls sharply below 15 percent load and above 90 percent speed where windage and iron loss dominate.
Reading the map correctly means finding where your machine actually lives, not where the contour is tallest. A floor scrubber spends 70 percent of its duty at 10 to 25 Nm and 300 to 600 rpm, so the relevant number is the local map value there, not the headline 90 percent peak. When a supplier sends only a single number, ask for the efficiency map across the full operating envelope before you trust any claim. A map with fewer than 40 stabilized points is too coarse to be useful, and one that is suspiciously flat above 88 percent across the whole low-speed region is a warning sign rather than a selling point.
Rated, Peak, and Weighted Efficiency Are Not the Same
Peak efficiency is the single best point on the map, almost always near 70 percent load. It is a marketing figure, not a design input. Rated efficiency is the value at the continuous duty point, for example 150 Nm at 1500 rpm held for one hour, and is what cooling and thermal limits allow all day. Weighted efficiency applies a WLTP-style duty cycle weighting or your own measured usage histogram to the map, giving the number that predicts real energy consumption.
For an AGV the weighted value may land 6 to 9 points below peak because the vehicle accelerates, coasts, and brakes far from the sweet spot. We have seen transaxles advertised at 91 percent peak that deliver only 82 percent weighted efficiency on a typical warehouse duty cycle. The gap comes from long idle and low-load cruising where iron loss and seal drag are a large share of a small input. When you compare two suppliers, insist on the same weighting curve; otherwise the comparison is meaningless. A useful internal rule is to discount any quoted peak by 8 to 12 percent to estimate field weighted efficiency until you have your own data from a representative bench run.
No-Load Current and Drag Torque as Quick Health Metrics
Before running a full map, two quick metrics tell you a lot. No-load current is the amps drawn at rated voltage with the output shaft free. A healthy 48 V, 3 kW transaxle should show a no-load current below 2.5 A; values above 4 A usually mean excessive seal drag, tight bearings, or a magnetically unbalanced rotor. Drag torque is the torque needed to spin the output by hand or with a low-speed motor with the unit unpowered; it should be under 1.5 to 2.5 Nm for a similar size.
High drag torque directly raises the no-load current and steals efficiency at light load, where many machines spend most of their time. These two numbers are also the easiest to verify on incoming inspection. Measure no-load current at 25 C and again at 60 C; a rise beyond 15 percent suggests thermal sensitivity in the magnetic circuit or a grease that thins too much with temperature. Keep a baseline from your first approved sample and reject lots that drift more than 10 percent. This single test, taking under five minutes per unit, catches most of the bad batches before they reach the assembly line and protects your weighted efficiency without a full mapping campaign.
Thermal Derating and Its Effect on Sustained Output
Efficiency is not constant with temperature. As copper heats, its resistance climbs about 0.4 percent per C, raising I²R loss, while magnet flux can drop and increase current demand to hold the same mechanical output. A transaxle rated for 150 Nm continuous at 25 C may enter thermal derating after 40 minutes of hill climbing, cutting allowed torque to 110 Nm and dropping efficiency by 2 to 4 points as the controller pushes more current to maintain speed.
Temperature rise from a 40 C ambient to an 85 C winding limit is common in a sealed transaxle with no forced cooling. The practical effect is that a machine’s effective duty cycle is set by heat, not by the nameplate torque. Test reports should state the soak time and the winding or oil temperature at each efficiency point; a map taken cold at 25 C overstates field performance. Ask for efficiency at both 25 C and at the stabilized hot temperature after a one-hour load, and use the worse case for range calculations. For outdoor equipment in summer, add 10 to 15 C of ambient margin. Ignoring thermal behavior is the most common reason a prototype passes the lab but fails in the field, where ambient heat and repeated duty cycles compound.
Converting 1 Percent Efficiency into Real Range and Runtime
The business case for efficiency is simple arithmetic. Take a 1.5 ton electric pallet truck with a 48 V, 40 Ah pack storing 1.92 kWh. At 85 percent system efficiency it delivers, say, 12 km of travel per charge; at 86 percent it delivers 12.14 km, a 1.2 percent range gain. Across a fleet of 200 trucks doing three charges per day, that extra 0.14 km per charge is 84 km of free travel daily, roughly one less charging shift per week per site.
For a floor scrubber drawing 2.5 kW average over an 8 hour shift, raising transaxle efficiency from 83 to 84 percent cuts energy by about 30 Wh per hour, or 240 Wh per shift, worth real money at industrial tariff rates and extending battery life by reducing depth of discharge. The conversion factor depends on vehicle mass, rolling resistance, and duty, but a working rule is that each 1 percent point of transaxle efficiency is worth 1.0 to 1.5 percent of pack-level range. When you source, a supplier offering 89 percent weighted versus 85 percent is not a marginal choice; over a 5 year equipment life it can mean 4 to 7 percent lower operating cost, enough to swing a total cost of ownership comparison in a competitive bid.
How to Read a Supplier Test Report and Compare Apples to Apples
A credible report lists the test standard, the rig type, ambient and coolant conditions, supply voltage and tolerance, and the transducer calibration dates. Look for calibrated torque transducer readings with a stated uncertainty, not calculated values derived from the motor nameplate. Verify the efficiency curve shape: a map that is uniformly high above 85 percent across the whole low-speed region is suspicious, because real gear sets show a clear efficiency ridge with visible falloff at the edges.
Check that the peak occurs around 60 to 80 percent load, which matches physics; a claim of 93 percent at 10 percent load is a red flag for measurement error or selective reporting. Compare the reported no-load current and drag torque against the norms above. Ask whether the motor controller used in the test matches the one you will ship, since field-oriented control tuning changes losses by 1 to 3 points. A report without a raw data appendix, without calibration certificates, or with efficiency computed only at the optimum point should be treated as marketing, not engineering evidence, and excluded from any side-by-side supplier scorecard you build.
Tip: Always request the test rig’s calibration certificate and the raw torque-speed sweep data, not just a single peak efficiency number, before you shortlist a transaxle supplier.
Standardizing Test Conditions and Spotting Overstated Data
To compare suppliers fairly, fix the test conditions yourself. Specify 48 V nominal, or your own pack voltage, with plus or minus 2 percent regulation, 25 C ambient for the cold map and a defined soak procedure for the hot map, speed points every 200 to 300 rpm, and torque points at 10, 25, 50, 75, 100, and 120 percent of rated. Demand the same gear oil grade and fill volume, since a thinner oil can lift efficiency 1 to 2 points but may fail your sealing or temperature limits in the field.
Watch for voltage tricks: quoting efficiency at 54 V instead of 48 V makes the controller run at lower current and lower I²R loss, overstating by 2 to 3 points. Watch for omitting the electromagnetic brake drag if your application uses a brake; a disengaged brake still adds 0.3 to 0.6 Nm of steady loss. The cleanest defense is to require that all bidders test on an identical third-party rig or submit units to your own bench using one shared procedure, so the comparison reflects the hardware and not the test artistry. When two quotes differ by more than 2 points, the cause is almost always the conditions, not the gears.
Writing Efficiency into Technical Agreements and Acceptance Clauses
Efficiency belongs in the contract, not just the brochure. Set a minimum weighted efficiency at your duty cycle, for example 86 percent weighted at the AGV load histogram, measured per the shared procedure, with a tolerance of plus or minus 1 point. Define acceptance as a statistical pass: 9 of 10 sampled units meet the threshold, not a single golden sample pulled from a bin.
Specify the test temperature, voltage, and soak, and require submission of raw data and calibration certificates with each lot. Include a thermal clause: efficiency at the one-hour hot soak must not fall more than 3 points below the cold value. Add a penalty or return-right if delivered units drift beyond the agreed band, and a re-qualification trigger if the supplier changes gears, oil, or controller firmware. Treat the efficiency map as a controlled document; any revision needs your written approval. This turns a vague sales claim into a measurable, enforceable specification and protects your vehicle’s certified range or runtime from silent supplier cost-cutting that shows up only after the warranty clock starts.
FAQ: Electric Transaxle Efficiency and Range for OEM Buyers
What system efficiency should I expect from a commercial electric transaxle?
For a 48 V to 80 V integrated transaxle in the 2 to 5 kW class, expect 87 to 91 percent peak and 82 to 86 percent weighted on a real duty cycle. Larger 7 to 15 kW units for utility vehicles often reach 90 to 93 percent peak thanks to better winding fill and larger gears, but their weighted figures still sit several points lower. Anything advertised above 94 percent peak for a cost-sensitive integrated unit deserves a hard look at the test method and the voltage it was measured at before you believe it.
How many test points make an efficiency map credible?
A credible map uses at least 8 speed lines and 6 torque columns, roughly 48 to 96 stabilized points, plus no-load and hot-soak measurements. Fewer than 30 points hides the efficiency ridge and lets a supplier cherry-pick the contour. Request the full point list and the raw torque and current traces, not just the smoothed contour plot, and confirm that each point was held long enough for thermal stabilization before the reading was taken.
Does a higher pack voltage always improve transaxle efficiency?
Higher voltage lowers phase current for the same power, reducing I²R copper loss, so 80 V is often 1 to 3 points better than 48 V at equal mechanical output. But it demands different insulation, bearings, and controller, and the gain shrinks once copper loss is already small relative to iron and mechanical losses. Pick voltage for the whole system, then optimize the transaxle within it. See our guide on choosing voltage for the full trade-off discussion before you commit a platform.
Can I verify a supplier’s efficiency data with my own bench?
Yes, and you should for any high-volume program. A single unit on a load dynamometer with a calibrated torque transducer and a known supply gives a fair check in two to three days. Use the shared procedure from the standardization section so the numbers are comparable. Differences within 1 point are normal instrument scatter; differences beyond 2 points mean the quoted map does not represent production hardware, and you should trigger the re-qualification clause in your agreement.
Should the contract specify peak or weighted efficiency?
Always specify weighted efficiency at your actual duty cycle, with peak as a secondary reference. Peak is easy to game and rarely matches field use. The weighted clause, tied to a defined load histogram and test procedure, is what protects your vehicle’s real range, runtime, and battery cost over the product life, and it gives you a defensible acceptance test when a shipment arrives that looks good on paper but underperforms on the floor.
Related Pages
- Electric Transaxle Technical Specifications Guide
- What Voltage Electric Transaxle Should You Choose
- Electric Transaxle vs Gearbox
- How to Match Electric Transaxle with Motor
Post time: Sep-28-2026